Appendix: Additional Accessibility Information
Cornell University is committed to diversity and inclusiveness and is in the process of making its websites and content accessible to all, regardless of ability or disability. The Cornell Library is asking authors to follow best practices for accessibility in all newly submitted materials, including electronic theses and dissertations.
To make your dissertation accessible, you can use a few simple techniques as you write. These techniques will allow your dissertation to be read by adaptive devices, ensuring the content is accessible to any user now and later in the process. It is recommended that you check your work for accessibility concerns as you write. More information is available under Check Your Work.
Before You Begin
Before you begin writing, make any stylistic decisions you will need to ensure consistency throughout your document.
- Set up your styles, including a primary font and size and at least four styles of headings. In Word, you will do this using the Styles Pane.
- Choose round or square bullet points for lists.
- Choose numbers and letters or just numerals for outlines.
Format Your Text
Properly formatted text not only makes it easier for users with assistive technology to navigate your document, but also makes the drafting process more efficient. Word can auto-generate your table of contents, saving you time and ensuring accuracy. The table of contents will reveal any errors you may have missed. In Word, use the Styles Pane to format your text.
Format Your Text
- Open the Styles Pane in the top right of the Home menu bar.
- Determine which style you want to use.
- Select Modify Style in the drop-down menu to the right of the style name.
- Edit the heading properties. Click OK.
- Repeat steps 2-4 with as many headings or styles as needed.
- If you don’t see a style you like, you can create your own by either modifying an existing style, as described above, or by typing in the desired style and saving it.
Now that you have set up your styles, use these to indicate the reading order of your document by labeling your headings.
Insert Your Table of Contents
Properly formatting your text throughout the document will allow Word to auto-generate a table of contents. Use the following steps to auto-generate your table of contents:
- Click on the References tab on the menu bar.
- Click Table of Contents.
- Select the Table of Contents format you would like to use.
Create Accessible Lists
Although using hyphens, asterisks, and other keyboard symbols will signify a list to a sighted user, assistive technology does not recognize informal, visual symbols as lists, leaving some users unclear on your content. To format your lists:
- Click on the bullet point list or numbered list icon.
- Create your list.
Create Accessible Tables
A list of tables is used to organize the locations of all tables throughout your document, making information easier for readers to find. Similar to a table of contents, Word can autogenerate your list of tables if they have been properly tagged. There are a few steps to making sure a screen reader can process a data table properly.
Format Your Tables
- Click on the table.
- Click the Table Design tab on the home menu.
- Click on the Layout tab next to the Table Design tab.
- Select Properties on the left side of the menu tab.
- Click the Row tab and check the box to Repeat as header row at the top of each page.
- Click the Alt Text tab and add a title and description for the table.
Tag Your Tables
Use the following steps to tag your tables.
- Click on your table.
- Click on the References tab on the menu bar.
- Click Insert Caption.
- Add your table label in the Caption box.
- Select the Table label from the drop-down menu.
- Set any other specifications, then click OK.
Insert Your List of Tables
Use the following steps to auto-generate your list of tables:
- Click on the References tab on the menu bar.
- Click Insert Table of Figures.
- Change the caption label by clicking Tables.
- Check the relevant boxes.
- Click OK.
Make Your Images, Figures, and Charts Accessible
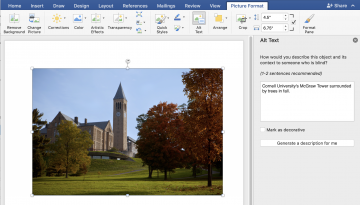
Adding captions and/or alternate (or “alt”) text to each image, figure, and chart allows users with assistive technology to understand your figure without seeing it. This means that the caption or alt text for a chart must include enough information for a user to understand what a sighted user could see.
Add Alt Text
- Insert your image/figure.
- Select image/figure.
- Click the Picture Format tab.
- Click the Alt Text button.
- Add image/figure description to alt text box in Alt Text window.
- See Penn State’s complex images pages for more help with alt text.
Tag Your Images, Figures, and Charts
Use the following steps to tag your images and figures.
- Click on your image or figure.
- Click on the References tab on the menu bar.
- Click Insert Caption.
- Add your table label in the Caption box.
- Select the corresponding label from the drop-down menu.
- Set any other specifications, then click OK.
Insert Your List of Figures
Use the following steps to auto-generate your list of figures:
- Click on the References tab on the menu bar.
- Click Insert Table of Figures.
- Change the caption label by clicking Figures.
- Check the relevant boxes.
- Click OK.
Make Your Charts Accessible
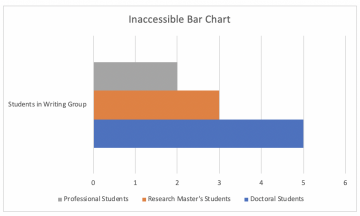
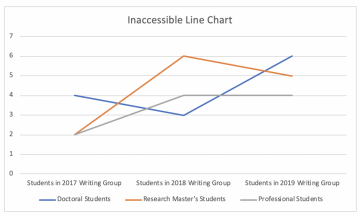
Charts can be an accessibility concern for colorblind readers. If the color shades are too similar in grayscale, the user may not be able to differentiate them. This renders the chart’s data inaccessible. There are several ways to create charts that adhere to accessibility standards:
- Provide an alternate presentation of data.
- Use multiple shades of the same color.
- Use a texture or pattern to differentiate.
- Use a clear legend and labeling system.
Provide an Alternate Presentation
The most effective way to enable all users to see and understand the data, regardless of ability to perceive color differentiation, is to provide a text description for each chart. Although alt text can help clarify data presented by a chart, writing it out in text form or pairing it with a data table are the clearest methods of presentation. Additionally, giving readers a detailed description can help general comprehension of the material.
Use Multiple Shades of the Same Color
Selecting different colors to represent each piece of data on a chart will indicate a clear distinction to visually able users. However, if each color is of the same brightness, colorblind users might not be able to discern a difference. Using multiple shades of the same color is often a solution to this problem, as the color selections vary in levels of brightness and darkness.
Use a Texture or Pattern to Differentiate
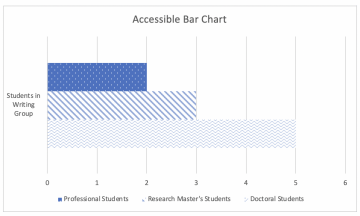
In addition to using different shades for each portion of the chart, each part of the chart should also be differentiated by a pattern or texture. For example, a dark blue bar on a bar chart could have polka dots, while a medium blue bar has diagonal lines and a light blue bar has chevrons. For a line chart, this might take the form of several variations on a dashed line. This way, when the chart is viewed in grayscale or by a colorblind reader, the data will appear distinctively different.
Use a Clear Legend and Labeling System
When using visual markers like color and pattern to identify data, it is important to include a legend. This serves as an extra way to clarify the data. In addition, each bar of a bar chart or trend line on a line chart, for example, should have a text label accompanying it.
Examples
Bar Charts
Accessible Bar Chart
| Professional Students | Research Master's Students | Doctoral Students | |
|---|---|---|---|
| Students in Writing Group | 2 | 3 | 5 |
Line Charts
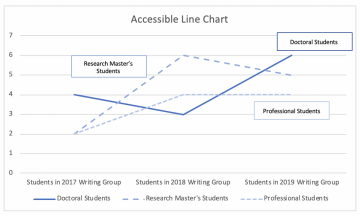
Accessible Line Chart
| Students Per Year | Doctoral Students | Research Master's Students | Professional Students |
|---|---|---|---|
| Students in 2017 Writing Group | 4 | 2 | 2 |
| Students in 2018 Writing Group | 3 | 6 | 4 |
| Students in 2019 Writing Group | 6 | 5 | 4 |
For more information and examples, visit Penn State’s Charts & Accessibility page.
Make Your Symbols Accessible
Even standard symbols can pose issues for screen readers. When possible, add alt text for your symbols to better explain what the symbol is conveying. To use alt text:
- Insert your image/figure.
- Select image/figure.
- Click the Picture Format tab.
- Click the Alt Text button.
- Add image/figure description to alt text box in Alt Text window.
Make Your Abbreviations Accessible
There are a few things you can do to make your abbreviations accessible:
- Use periods between letters for acronyms. Periods will allow a screen reader to read each letter of the acronym, rather than pronouncing it as one word.
- Always completely spell out the words the acronym stands for.
Check Your Work
Word provides an accessibility checker that will tell you if there are any accessibility concerns within your document. Due to the length of theses and dissertations, it is recommended that you check your document at the end of each chapter for accessibility issues rather than waiting until the end. To check accessibility:
- Click on the Review tab on the menu bar.
- Click Check Accessibility.
- Review the window that will pop up to the right of your document with any inaccessible elements.
- Make the recommended fixes.
Export an Accessible PDF
To export your Word document to an accessible PDF:
- Click the File menu.
- Select Save As.
- Click File Format.
- Select PDF.
- Select the radio button that says Best for electronic distribution and accessibility.
- Click Export.

